Chapter 1: Preface
The steel industry is universally recognized as a strategic industrial sector because it functions as the backbone of infrastructure development, capital formation, manufacturing expansion, and national defensecapability. In emerging economies, steel intensity per capita is often used as a proxy for industrial maturity. In the case of Indonesia, the period 2020– 2025 marks a decisive structural phase in which the domestic steel industry began transitioning from an import-dependent consumption market toward a more capacity-driven and policy-protected industrial ecosystem.
Indonesia is the largest economy in Southeast Asia, accounting for roughly 35–40% of ASEAN GDP. With a population exceeding 286 million people (est. 2026) and sustained urbanization rates above 50%, structural demand for steel is inherently embedded in the country’s development trajectory. Yet despite strong domestic consumption growth, Indonesia historically underperformed in domestic steel production relative to demand, particularly in flat steel products and higher-grade applications.
Between 2020 and 2025, the Indonesian steel sector operated under extraordinary global and domestic circumstances. This five-year window encompasses:
- The COVID-19 global industrial contraction (2020)
- Global steel price Supercycle (2021–2022)
- Post-pandemic infrastructure acceleration (2022–2024)
- Implementation of global decarbonization policies (2023 onward)
- Indonesia’s mineral down streaming and industrial upgrading strategy
These overlapping forces produced both structural stress and structural opportunity for Indonesia’s steel producers.
The Threat of Cheaper Product
During the 2010s, PT Krakatau Steel entered into a strategic joint venture with Japan’s Osaka Steel Co., Ltd., forming PT Krakatau Osaka Steel (KOS) in 2014 with the objective of producing long steel products such as reinforcing bars and profiles for the domestic Indonesian market, combining local market access with foreign expertise; however, despite initially recording profitability upon commercial operation in 2017, the venture faced escalating financial pressure from 2022 onward as cheap imported steel — particularly long products from China — flooded the Indonesian market and eroded local price competitiveness, while asignificant reduction in government infrastructure spending in 2025 further diminished domestic demand,leading to continued operational losses and structural negative free cash flow, ultimately forcing Osaka Steelto withdraw and begin liquidating KOS in mid-2026 after unsuccessful attempts to find a strategic buyer, underscoring how global oversupply and import competition can undermine joint ventures lacking cost and scale advantages in protected domestic sectors.
1.1 Steel as an Industrial Multiplier in Indonesia
Steel is not a standalone commodity industry; it is an upstream enabler for at least seven core economic sectors:
- Construction and real estate
- Infrastructure (roads, ports, rail, airports, energy plants)
- Automotive manufacturing
- Shipbuilding and maritime
- Oil & gas and petrochemical facilities
- Heavy equipment and machinery
- Renewable energy installations
In Indonesia, gross fixed capital formation (GFCF) consistently accounts for approximately 30–32% of GDP. Infrastructure and construction alone contribute around 10–11% of GDP annually. Steel demand is highly elastic to this capital expenditure pattern.
Indonesia’s steel consumption per capita remains significantly below developed industrial economies. Estimated apparent steel use per capita:
- Indonesia (2024): ~65–70 kg per capita
- Vietnam: ~240 kg per capita
- Malaysia: ~300 kg per capita
- South Korea: >1,000 kg per capita
- Global average: ~230 kg per capita
This data reveals two structural realities:
- Indonesia is underpenetrated relative to its population size.
- Long-term growth potential remains substantial as urbanization and industrialization deepen.
1.2 Structural Steel Demand Composition (2024 Baseline)
Approximate sectoral distribution of steel demand in Indonesia:
- Building construction: 45–50%
- Infrastructure projects: 15–20%
- Automotive and transportation: 10–12%
- Manufacturing machinery: 7–8%
- Energy (including smelters & power plants): 5–7%
- Shipbuilding and others: 3–5%
Indonesia’s demand profile is still dominated by long products (rebar, wire rod, sections). However, the share of flat steel (HRC, CRC, coated sheet) has increased due to:
- Expansion of automotive manufacturing
- Domestic appliance production
- Growth of industrial equipment fabrication
- Emergence of EV battery ecosystem
This structural shift is critical because flat steel has historically been import-dominated.
1.3 Global Steel Market Context
Global crude steel production (approximate):
- 2020: 88 billion tons
- 2021: 96 billion tons
- 2022: 88 billion tons
- 2023: ~1.89 billion tons
- China share: ~53–55%
China’s structural overcapacity remains the single most influential factor affecting global steel pricing. When domestic Chinese demand slows (as seen in 2022–2024 due to property sector weakness), excess capacity flows into export markets, including ASEAN.
Indonesia’s steel market is therefore highly exposed to:
- Dumping risk
- Price volatility
- Import surge dynamics
During 2021–2022, global steel prices surged dramatically:
Hot Rolled Coil (benchmark):
- Pre-pandemic: ~USD 450–550/ton
- 2021 peak: >USD 1,000/ton
- 2023 normalization: ~USD 600–700/ton
Indonesian producers experienced margin expansion during price spikes but faced intense competition during normalization.
1.4 Structural Production Model of Indonesia
Indonesia’s steel production is predominantly Electric Arc Furnace (EAF)-based, which relies on:
- Scrap metal
- Imported billet
- Direct Reduced Iron (limited domestic supply)
Key structural characteristics:
- Limited integrated blast furnace capacity (although expanding)
- Fragmented long steel mills using induction furnaces
- Limited domestic high-grade automotive sheet production
- Growing stainless steel cluster linked to nickel resources
Indonesia’s comparative advantage lies in nickel. With over 20% of global nickel reserves, the country developed a competitive stainless steel export industry through integrated industrial parks. This created a dual steel structure:
- Carbon steel segment (import-sensitive)
- Stainless steel segment (export-oriented and competitive)
1.5 Trade Structure Imbalance
Indonesia historically runs:
- Trade deficit in carbon flat products
- Trade surplus in stainless steel semi-finished
Major import sources (2020–2024):
- China
- Japan
- South Korea
- India
- Vietnam
Major export destinations:
- China (stainless)
- India
- ASEAN
- Limited exports to EU/US
Despite rising domestic capacity, Indonesia continues to import higher-grade automotive steel and specialty alloys due to:
- Technological gaps
- Quality standard requirements
- Limited domestic rolling sophistication
1.6 Infrastructure and Capital Projects (Demand Drivers)
Major infrastructure drivers (2020–2025):
- Toll road expansion (Trans-Java, Trans-Sumatra)
- Port modernization
- Railway networks
- IKN Nusantara construction
- Industrial estate expansion (Batang, Morowali, Cilegon)
- Smelter development under mineral down streaming policy
The development of IKN alone is estimated to require 1–2 million tons of steel during the primary construction phase (2023–2027).
Simultaneously, nickel smelters and battery plants significantly increased structural steel demand.
1.7 Energy and Cost Structure Pressure
Steel production cost structure in Indonesia typically comprises:
- Raw material (45–60%)
- Energy (20–25%)
- Labor (5–8%)
- Logistics (8–12%)
- Financial cost (5–7%)
Indonesia’s industrial electricity tariffs are higher than in some competing markets such as Vietnam or China (subsidized energy). Moreover, logistics costs are elevated due to Indonesia’s archipelagic geography.
These cost factors limit Indonesia’s competitiveness in commodity-grade exports but are less restrictive in protected domestic segments.
1.8 ESG and Carbon Transition
The steel industry globally contributes approximately 7–8% of global CO₂ emissions. The EU introduced Carbon Border Adjustment Mechanism (CBAM), which gradually phases in reporting (2023–2025) and financial adjustment (post-2026).
Indonesia’s steel industry is largely coal-powered due to electricity mix dominated by coal (>60%). Without energy transition:
- Export competitiveness to EU may decline.
- Financing costs may increase due to ESG pressure.
- Green steel premium markets may remain inaccesible.
This creates a long-term structural risk.
1.9 Structural Opportunity Window (2020–2025)
The period 2020–2025 represents a structural inflection point because:
- Domestic demand is expanding steadily.
- Government policy favors import substitutions.
- Industrial down streaming increases steel intensity.
- ASEAN regional integration opens export opportunities.
- Stainless steel has achieved global scale competitiveness.
However, structural weaknesses remain:
- Technology gap in high-grade flat products
- Dependence on imported scrap
- Energy inefficiency
- Fragmented industry structure
Indonesia’s steel industry stands at a strategic crossroads between remaining a protected domestic supplieror evolving into a competitive regional production hub.
Chapter 2: Market Trends and Size of Steel Industry in Indonesia
2.1 Indonesia’s Steel Market in Regional and Global Context
Indonesia represents the largest steel-consuming economy in ASEAN by population scale, though not yet by total volume. Between 2020 and 2025, Indonesia accounted for approximately 30–35% of total ASEAN apparent steel consumption.
Estimated ASEAN steel consumption (2024):
- Vietnam: ~25–26 Mt
- Indonesia: ~18–19 Mt
- Thailand: ~15–16 Mt
- Philippines: ~10–11 Mt
- Malaysia: ~7–8 Mt
While Vietnam surpasses Indonesia in total volume, Indonesia’s demographic scale and infrastructure pipeline suggest stronger long-term structural expansion potential. Globally, Indonesia remains outside thetop 15 steel-consuming countries but ranks among the fastest- growing mid-tier markets.
2.2 Apparent Steel Consumption Trend (2020–2025)
Apparent steel consumption (ASC) reflects domestic production + imports – exports.
Estimated crude steel equivalent consumption:
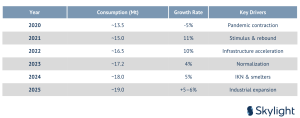
Five-year CAGR (2020–2025): ~7.1–7.5%
Key observations:
- Recovery was V-shaped post-
- Growth slowed after 2022 as prices
- Underlying demand remains structurally
2.3 Per Capita Steel Consumption Analysis
Estimated steel use per capita (2024):
- Indonesia: ~68 kg
- Vietnam: ~240 kg
- Thailand: ~250 kg
- Malaysia: ~300 kg
- Global average: ~230 kg
- South Korea: ~1,000+ kg
Indonesia’s low steel intensity reflects:
- Lower industrialization depth.
- Higher share of informal construction.
- Limited domestic automotive penetration per capita.
- Manufacturing share of GDP (~19%) below industrial economies.
If Indonesia’s per capita consumption increases to:
- 120 kg → demand ~33 Mt
- 150 kg → demand ~41 Mt
This illustrates significant long-term expansion headroom.
2.4 Product-Level Market Breakdown
2.4.1 Long Steel Segment
Estimated long steel consumption (2024): ~11–12 Mt Composition:
- Rebar: 65%
- Wire rod: 15%
- Sections: 10%
- Others: 10%
Primary drivers:
- Housing projects
- Government infrastructure
- Industrial building expansion
Rebar demand correlates with:
- Residential construction permits
- Public works budget
- Cement consumption trends
Indonesia’s cement consumption (2024): ~65–70 Mt. Steel demand typically tracks cement consumption growth trends.
2.4.2 Flat Steel Segment
Estimated flat steel consumption (2024): ~6–7 Mt Composition:
- HRC: ~50%
- CRC: ~25%
- Coated & galvanized: ~20%
- Specialty sheet: ~5%
Flat steel growth (2021–2025 CAGR): ~8–9%. Flat steel remains partially import-dependent.
2.5 Stainless Steel Market Dynamics
Indonesia’s stainless-steel production expanded significantly due to nickel down streaming. Estimated stainless steel crude production (2024): ~5–6 Mt. Indonesia transitioned from importer to major exporter in stainless segment.
Key driver:
- Nickel ore export ban
- Integrated industrial park investment
- Foreign direct investment scale
Stainless steel demand domestically remains smaller (~1 Mt), with majority exported.
2.6 Import Penetration Ratio by Product Flat Steel Import Penetration:
- 2020: ~45%
- 2022: ~40%
- 2024: ~35%
- 2025 (est.): ~30–32%
Long Steel Import Penetration:
- 2020: ~20%
- 2022: ~25%
- 2024: ~18%
- 2025: ~15–18%
Protection measures reduced long steel import share more effectively than flat products.
2.7 Capacity vs Demand Balance
Estimated crude steel production capacity (2025): ~22–23 Mt Estimated demand (2025): ~19 Mt
Capacity utilization rate: ~80–85% However,product mismatch exists:
- Surplus in certain long products
- Deficit in high-grade flat products
This structural imbalance explains continued imports.
2.8 Investment Flow (2020–2025)
Major investment trends:
- Integrated steel complex upgrades
- Stainless steel industrial parks (Morowali)
- Rolling mill modernization
- Energy efficiency retrofitting
Estimated steel-related FDI inflow (2020–2024 cumulative): >USD 8–10 billion (primarily stainless sector)
2.9 Demand Drivers Outlook to 2030
Projected demand if GDP grows at ~5% annually:
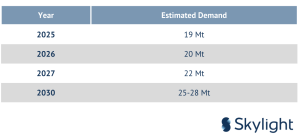
Upside scenario (accelerated industrialization): 30 Mt by 2030.
2.10 Key Structural Observations
- Indonesia is a structurally growing steel
- Long steel remains dominant but flat steel growing
- Import penetration declining gradually but still
- Stainless steel segment globally
- Market remains infrastructure-driven rather than manufacturing-
Chapter 3: Production, Consumption, Export and Import Statistics
3. Production, Consumption, Export and Import (2020–2025)
Historically, Indonesia has been characterized as a consumption-driven steel market with persistent import dependence—particularly for flat steel products and higher-grade materials. Domestic production was traditionally concentrated in long products such as rebar and wire rod, supported by infrastructure and construction demand.
However, this structural imbalance began to narrow during 2020–2025 as new capacity investments—especially in flat steel and stainless steel—came online.
The interplay between production growth and import penetration during this five-year period is critical to understanding the industry’s transformation. In 2020, Indonesia’s crude steel production stood significantly below domestic consumption, resulting in a wide trade deficit. By 2025, aggregate production nearly matched apparent consumption, bringing Indonesia close to trade neutrality in volume terms. Yet beneath this surface-level convergence lies a more complex structural reality: product mismatch persists, value-added differentials remain substantial, and dependency on imported raw materials continues to shape cost structures.
Another defining characteristic of this period is the divergence between carbon steel and stainless-steel segments. While carbon steel—particularly flat products—remained partially import-reliant, stainless-steelproduction expanded rapidly due to Indonesia’s nickel resource advantage and integrated industrial parkinvestments. As a result, Indonesia transitioned into a significant stainless-steel exporter even while remaining a net importer of certain carbon steel categories. This dual structure underscores the importance of resource integration, industrial scale, and policy alignment in determining segment-level competitiveness.
From a macroeconomic standpoint, steel production trends during 2020–2025 were influenced by four major factors:
- Post-pandemic recovery and infrastructure stimulus
- Global steel price Supercycle (2021–2022)
- Trade defense measures (safeguards and anti-dumping)
- Capacity expansion and modernization investments
3.1 Crude Steel Production (Time Series 2020–2025)
Estimated crude steel production (Million Tons):
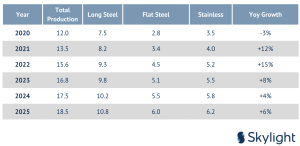
*2025 estimated Observations:
- Flat steel production grew at ~16% CAGR (2020–2025).
- Stainless steel production nearly doubled in 5
- Long steel growth was steady but moderate (~7–8% CAGR).
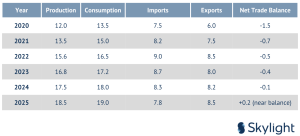
3.2 Trade Balance (2020–2025)
Indonesia approaching near trade neutrality by 2025 in aggregate volume, but still imbalanced by product type.
Chapter 4: Major Players in the Industry
4.1 Industry Structure and Ownership Landscape
Indonesia’s steel industry between 2020 and 2025 is characterized by a hybrid structure
consisting of:
- State-owned enterprises (SOEs)
- Large private domestic industrial groups
- Foreign direct investment (FDI)-driven integrated steel clusters
- Joint ventures between Indonesian and foreign corporations
The competitive dynamics differ substantially across carbon steel and stainless-steel segments. Carbonsteel production remains partially domestically controlled, while stainless steel production is heavilydominated by foreign-invested integrated industrial park operators, primarily from China. Unlike Vietnam or India, where national private conglomerates dominate the sector, Indonesia’s steel landscape reflects a mix of legacy state-owned enterprises and aggressive foreign capital expansion.
The Indonesian steel industry between 2020 and 2025 reflects a transitional industrial structure shaped by historical state involvement, private domestic entrepreneurship, and aggressive foreign direct investment (FDI) in resource-linked segments. Unlike fully liberalized steel markets or highly consolidated national champion models seen in countries such as South Korea or India, Indonesia’s steel ecosystem remains structurally hybrid and segment dependent.
At a macro level, the industry can be categorized into three principal ownership pillars:
- State-Owned Enterprises (SOEs) – Led primarily by PT Krakatau Steel, historically established as part of Indonesia’s early industrialization agenda.
- Private Domestic Groups – Concentrated in long steel production serving construction and infrastructure markets.
- Foreign Direct Investment (FDI) Operators – Particularly dominant in stainless steel production through vertically integrated industrial park models.
This layered ownership composition reflects Indonesia’s broader industrial policy evolution. During the early decades of national development, steel production was considered a strategic sector requiring stateleadership. The establishment of Krakatau Steel in the 1970s symbolized Indonesia’s ambition to buildfoundational heavy industry. However, subsequent decades saw limited modernization and capital constraints, allowing private and foreign players to gradually expand their footprint.
Between 2020 and 2025, this structural composition became more pronounced. Carbon steel production—especially flat products—remained partially dependent on the state-owned flagship, while stainless steel production became increasingly foreign-invested and export- oriented. Meanwhile, long steel production, closely tied to construction cycles, remained largely in the hands of domestic private conglomeratesoperating electric arc furnaces (EAF) and induction furnaces.
This segmentation has significant competitive implications.
- In carbon flat steel, the market is semi-concentrated and policy sensitive. The government plays an active role through procurement preferences, safeguard measures, and domestic content requirements (TKDN). The objective is to protect strategic domestic capacity while gradually upgrading technological standards. However, production scale and cost efficiency remain below that of major Asian integrated producers.
- In stainless steel, the industry operates under a fundamentally different Here, FDI-driven industrial clusters—anchored by vertically integrated operations from nickel ore processing to stainless slab production—have achieved scale efficiencies and export competitiveness. The integration of upstream mineral resources provides structural cost advantage, differentiating stainless from carbon steel dynamics. As a result, Indonesia transitioned into a global stainless-steel exporter during this period, even while continuing to import certain carbon steel grades.
- In long steel, market fragmentation persists. Dozens of rolling mills operate across Java and other industrial regions, though the top five producers control a majority share. Long steel is primarilydriven by domestic demand—housing, public works, and infrastructure—making it less export-oriented and more sensitive to government budget cycles and safeguard policies. Price competition is intense, and product differentiation is limited.
Another defining feature of Indonesia’s steel ownership landscape during 2020–2025 is the role of industrial parks and geographic clustering. Morowali Industrial Park in Central Sulawesi became synonymous with stainless steel integration, supported by Chinese investment and resource proximity. Cilegon in Banten remains the traditional carbon steel hub anchored by Krakatau Steel and related facilities. These geographic concentrations influence logistics efficiency, cost structure, and supply chain integration.
From a capital structure perspective, domestic producers—particularly state-owned enterprises—have historically faced leverage constraints and refinancing challenges. In contrast, foreign-invested stainless operators often benefit from strong parent company balance sheets and global capital access. This divergence affects investment capability, modernization pace, and risk tolerance.
Between 2020 and 2025, industry consolidation trends were gradual but visible. Financial restructuring of legacy players, closure of inefficient induction furnaces, and increased emphasis on compliance with national standards contributed to a more disciplined market environment. Nevertheless, Indonesia’s steel industry remains less consolidated compared to regional peers such as Vietnam, where a few dominant integrated producers command larger market share.
Strategically, Indonesia’s ownership landscape reveals a dual-speed steel economy:
- A domestically oriented carbon steel sector supported by policy protection and infrastructure demand.
- A globally integrated stainless-steel sector driven by resource-based comparative advantage and export orientation.
This dual structure presents both opportunity and vulnerability. On one hand, it allows Indonesia toleverage its nickel resources to compete globally in stainless steel. On the other hand, it highlights continued structural gaps in carbon steel technology, scale, and competitiveness.
As Indonesia approaches the latter half of the 2020s, the sustainability of this hybrid ownership model will depend on several critical factors:
- Energy cost reforms and transition toward greener production.
- Continued protection balanced with trade compliance obligations.
- Consolidation and scaling of domestic carbon steel producers.
- Upgrading toward higher value-added products such as automotive-grade sheet.
- Financial resilience and access to long-term industrial capital.
Ultimately, the 2020–2025 period does not represent a fully mature industry structure but rather a reconfiguration phase in which ownership, scale, and competitiveness are actively being reshaped.
4.2 State-Owned Flagship Producer PT Krakatau Steel
Status: State-Owned Enterprise (SOE)
Major Shareholder: Government of Indonesia (~80%+)
Headquarters: Cilegon, Banten
Corporate Role
Krakatau Steel serves as Indonesia’s national strategic steel producer and remains central to domestic flat steel supply, public infrastructure procurement, and TKDN (local content requirement) implementation.
It operates through subsidiaries and joint ventures across:
- Hot Rolled Coil (HRC)
- Cold Rolled Coil (CRC)
- Galvanized products
- Limited long steel production
Production Capacity (2024–2025 Estimate)
Crude Steel Capacity: ~3.0–3.5 million tons per year HRC Rolling Capacity: ~2.4–2.8 Mt/year
CRC Capacity: ~1.0 Mt/year Galvanizing Capacity:~0.5 Mt/year
Utilization Rate (2024): ~75–80%
Financial Context
Krakatau Steel underwent major financial restructuring between 2018–2020 involving more than USD 2 billion in debt rescheduling. This restructuring was necessary due to:
- Persistent margin compression from low-priced imports
- High leverage ratio
- Structural inefficiencies
- Working capital constraints
Although the 2021–2022 global price surge temporarily improved earnings, structural cost competitiveness remains a challenge.
4.3 Stainless Steel Integrated Cluster PT IndonesiaTsingshan Stainless Steel
Status: Foreign Direct Investment (FDI)
Parent Company: Tsingshan Holding Group (China) Location:Morowali Industrial Park, Central Sulawesi
Investor Background
Tsingshan Holding Group is one of the world’s largest stainless-steel producers and the dominant global player in nickel-based stainless production. Its Indonesian investment strategy integrates:
- Nickel ore processing
- Nickel pig iron (NPI)
- Stainless slab production
- Rolling and finishing
This vertical integration significantly lowers cost per ton.
Production Capacity (2024–2025 Estimate)
Stainless Crude Steel: ~4–5 million tons annually Slab & Hot Rolling: ~3–4 Mt
Cold Rolling & Finished Products: Expanding capacity Utilization Rate: >85%
Competitive Position
Indonesia, through Tsingshan’s operations, has become one of the largest stainless-steel exporters globally.
Competitive Advantages:
- Nickel resource integration
- Industrial Park efficiency
- Energy cost synergies
- Scale economies
- Strong export orientation
Segment Dominance: Tsingshan group controls >70% of Indonesia’s stainless-steel output.
4.4 Private Domestic Long Steel Producers
The long steel segment is largely controlled by Indonesian private groups.
Gunung Steel Group
Status: Private Local Company
Ownership: Indonesian private conglomerate
Production Capacity:
- Crude Steel: ~2.0–2.5 Mt/year
- Rebar & Wire Rod Rolling: ~2.5–3.0 Mt/year
Focus:
- Reinforcing bars (rebar)
- Wire rods
- Construction steel
Market Position: Among the top 3 domestic long steel producers.
Master Steel Manufacturing
Status: Private Local Company Estimated Capacity:
- Long steel rolling: ~1.5–2.0 Mt/year
Focus:
- Rebar production
- Structural sections
Hanil Jaya Steel
Status: Private Local Company Capacity:
- Rolling capacity: ~1.0–1.5 Mt/year
Structural Characteristics of Long Steel Segment
Combined Top 5 Long Steel Producers:
- Total estimated capacity: ~7–8 Mt/year
- Market Share (Top 5): ~60%
Segment Features:
- Commodity-driven pricing
- Strong exposure to safeguard measures
- High sensitivity to construction cycles
- Scrap-dependent feedstock
4.5 Former Joint Venture Case
PT Krakatau Osaka Steel
Status: Joint Venture (Now Liquidated) Investors:
- PT Krakatau Steel (Indonesia)
- Osaka Steel , Ltd. (Japan)
Production Capacity (Prior to Exit):
- ~0.5–0.7 Mt/year long steel
Despite strong technical standards, the company could not sustain margins under import pressure and cost disadvantages, leading to eventual liquidation.
4.6 Emerging Flat Steel Private Investors
Indonesia has seen gradual entry of private flat steel rolling mills, particularly in:
- Galvanized sheet
- Coated steel
- Pipe and hollow section manufacturers
However, automotive-grade flat steel remains partially reliant on imports from Japan and Korea due to:
- Quality requirements
- Surface finishing precision
- Strength and tensile standard specifications
4.7 Industry Concentration Analysis
Stainless Steel: Highly Concentrated (Foreign Dominated) Flat Carbon Steel: Semi-Concentrated (SOE-Dominated) Long Steel: Moderately Fragmented(Private Local Players)
Herfindahl-Hirschman Index (qualitative estimate):
- Stainless: High concentration
- Flat: Medium concentration
- Long: Medium-Low concentration
4.8 Strategic Industry Observations
- Stainless segment is globally competitive due to FDI
- Carbon flat segment relies on state
- Long steel is domestically driven but structurally
- Foreign capital plays decisive role in high-growth
- Domestic private groups remain strong in construction
4.9 Forward Structural Questions (2025–2030)
- Will Indonesia attract FDI into carbon flat integration?
- Can Krakatau Steel modernize to global efficiency levels?
- Will long steel producers consolidate?
- Can Indonesia move into high-value automotive sheet?
Industry trajectory depends on:
- Policy consistency
- Energy cost reform
- Green steel transition
- Access to financing
- Domestic demand stability
Chapter 5: Government Policy
5.1 Regulatory Philosophy: From Passive Market to Strategic Protection
Between 2020 and 2025, Indonesia’s steel industry policy underwent a decisive transformation from reactive market management toward structured industrial intervention. The policy approach during thisperiod reflects a broader global shift: steel is no longer treated merely as a tradable commodity but as a strategic industrial asset linked to national resilience, infrastructure security, and economic sovereignty.
The experience of persistent import dependence, financial restructuring of major domestic producers, andthe earlier collapse of foreign joint ventures exposed structural vulnerabilities. As a result, the government adopted a regulatory posture that combined:
- Tariff instruments
- Anti-dumping enforcement
- Safeguard mechanisms
- Import licensing controls
- Domestic content mandates
- Mineral down streaming policy
This layered framework aimed to address not only unfair trade but also structural competitiveness gaps.
5.2 Tariff Architecture: Baseline Protection vs Strategic Shielding
Steel products fall primarily under HS Chapter 72 and 73. Indonesia’s Most Favored Nation (MFN) tariffrates during 2020–2025 generally ranged between 0% and 15%, depending on product classification.
Representative MFN tariff structure:
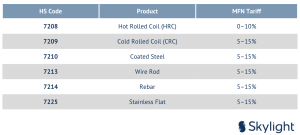
However, ASEAN Free Trade Area (AFTA) agreements reduced tariffs among ASEAN members to 0%,increasing competitive pressure from Vietnam and Thailand. The MFN tariff regime alone was insufficient to counteract structural dumping from large-scale exporters such as China. Therefore, Indonesia relied more heavily on trade defense instruments.
5.3 Anti-Dumping Policy: Legal Defense Against Price Distortion
Anti-dumping duties (ADD) became one of the most critical regulatory tools during this period. Anti-dumping investigations are conducted by Indonesia’s Anti-Dumping Committee (KADI) under Ministry of Tradeauthority, aligned with WTO Anti-Dumping Agreement provisions. The purpose of ADD is to counter imports sold below fair market value (normal value) that cause material injury to domestic industry.
Key Anti-Dumping Applications / ADD (2020–2025)
Cold Rolled Coil (HS 7209):
- Countries targeted: China, Japan, South Korea, Vietnam
- ADD rates: ~5% to 20% depending on exporter
Hot Rolled Coil (HS 7208):
- Periodic review and ADD adjustments
- Focused largely on Chinese imports
Rebar and Wire Rod (HS 7214, 7213):
- ADD rates: 10–20% on selected exporting countries
These measures were not blanket bans but targeted based on injury investigation findings.
Structural Impact of ADD
- Slowed flat steel import
- Supported domestic CRC/HRC
- Improved utilization rates above 75%.
- Stabilized price floor in domestic
However, anti-dumping measures have structural limitations:
- They are reactive and case
- They require evidence of dumping and
- They do not resolve cost inefficiency of domestic
- They may raise input cost for downstream
Thus, ADD serves as a defensive stabilization mechanism, not a competitiveness solution.
5.4 Safeguard Measures: Emergency Protection Against Import Surges
Unlike anti-dumping (which targets unfair pricing), safeguard measures address sudden import surges regardless of pricing behavior.
Safeguards were applied to:
- Hot Rolled Coil (HS 7208)
- Wire Rod (HS 7213)
- Rebar (HS 7214) Typical safeguardstructure:
Year 1: Additional duty (e.g., 10%)
Year 2: Reduced duty (e.g., 8%)
Year 3: Further reduction (e.g., 5%)
These measures are temporary and must be justified under WTO Safeguards Agreement.
Economic Consequences
Short-term benefits:
- Margin stabilization
- Reduced import penetration
- Investment breathing room
Trade-offs:
- Increased cost to downstream manufacturers
- Potential retaliation risk
- Legal exposure to WTO challenge
Safeguards are therefore transitional instruments designed to facilitate industry adjustment.
5.5 Import Licensing and Non-Tariff Measures
Beyond tariffs, Indonesia strengthened import control through administrative instruments:
- Importer Identification Number (API) regulation
- Pre-shipment verification requirements
- Technical standards compliance checks
- SNI (Indonesian National Standard) enforcement
These non-tariff barriers improved monitoring of:
- Product quality
- Volume flows
- Origin compliance
- Undervaluation risks
While not explicitly protectionist, administrative tightening reduced informal import leakage.
5.6 Mineral Down streaming Policy: Structural Industrial Shift
The nickel ore export ban (effective 2020) was not a steel regulation per se, but it fundamentally reshaped the stainless-steel industry. By prohibiting raw nickel export, the government forced investment into:
- Nickel smelters
- Nickel Pig Iron (NPI)
- Stainless steel slab production
- Integrated stainless rolling mills
This policy transformed Indonesia into a major stainless-steel exporter between 2020 and 2025.
Stainless exports increased from ~4 Mt (2020) to ~6 Mt (2025). This demonstrates that:
Resource-based industrial policy + scale investment = global competitiveness. In contrast, carbon steel lacks similar upstream integration.
5.7 Domestic Content Requirement (TKDN): Demand-Side Reinforcement
The TKDN framework requires minimum domestic content in:
- Infrastructure projects
- State-owned enterprise procurement
- Energy and power sector projects
For steel producers, TKDN acts as demand insurance. Benefits:
- Guaranteed baseline demand
- Reduced import competition in public projects
- Enhanced domestic capacity utilization
Challenges:
- Limited availability of certain specialized grades
- Cost concerns for contractors
TKDN represents a structural demand-side complement to supply-side protection.
5.8 Regulatory Tension: Protection vs Competitiveness
The 2020–2025 regulatory environment reveals a structural tension: Protection improves survival but may reduce efficiency pressure.
If protection persists too long:
- Incentive to modernize
- Cost gap
- Industry becomes subsidy
If protection is withdrawn too early: Domestic industry may collapse under import surge.
Thus, Indonesia faces a calibrated policy dilemma.
5.9 ESG, Carbon and Future Regulation
The EU’s Carbon Border Adjustment Mechanism (CBAM) creates future exposure. Although not yet a domestic regulation, CBAM effectively imposes:
- Carbon disclosure requirements
- Future carbon cost on exports
Indonesia’s coal-heavy energy mix raises carbon intensity risk. Without green transition incentives:
- Export competitiveness may
- Financing cost may
- International market access may
Future regulatory evolution may require:
- Renewable integration in steel plants
- Energy efficiency upgrades
- Potential domestic carbon pricing mechanism
5.10 Integrated Policy Assessment (2020–2025)
Policy Strengths:
- Reduced import penetration (especially long steel).
- Stabilized domestic producers during oversupply
- Enabled stainless steel global
- Supported infrastructure-driven
Policy Limitations:
- Does not fully solve cost competitiveness
- Carbon strategy remains
- Long steel remains
- Automotive-grade flat still import-
Indonesia’s steel policy during 2020–2025 can be summarized as: Stabilization First, Competitiveness Later. The next policy phase must transition from protective stabilization toward structural productivity enhancement.
Chapter 6: Potential Issues and Challenges
6.1 Structural Framing: Stability Achieved, Competitiveness Unfinished
Between 2020 and 2025, Indonesia’s steel industry demonstrated resilience. Production rose from approximately 12 million tons to nearly 18.5 million tons. Import penetration declined gradually. Stainlesssteel exports expanded significantly. Trade balance moved toward near neutrality. However, stabilization does not equate to structural competitiveness.
Beneath the surface of production growth and trade defense measures lies a series of unresolved structural constraints. These issues affect:
- Cost structure sustainability
- Technological capability
- Value-added depth
- Financial resilience
- Energy transition readiness
- Market structure efficiency
If unaddressed, these vulnerabilities could re-emerge during the next global steel downturn.
6.2 Structural Cost Disadvantage
6.2.1 Energy Cost and Carbon Intensity
Steel production via Electric Arc Furnace (EAF) is highly electricity dependent. Indonesia’s industrial electricity tariff remains relatively high compared to regional competitors.
Key constraints:
- Coal-dominated electricity (>60% of energy mix)
- Limited renewable integration
- Volatility in energy policy pricing
Energy accounts for approximately 20–25% of steel production cost. In contrast:
- China benefits from scale and state-managed industrial pricing.
- Vietnam leverages integrated blast furnace economies.
- India integrates iron ore and coal domestically.
Indonesia’s cost structure therefore remains vulnerable during price normalization periods.
6.2.2 Logistics and Geographic Fragmentation
Indonesia’s archipelagic geography increases:
- Domestic freight costs
- Inter-island distribution inefficiency
- Port handling delays
- Inventory holding cost
Logistics cost as percentage of GDP:
- Indonesia: ~23–25%
- Vietnam: ~16–18%
- Malaysia: ~13–15%
High logistics cost reduces domestic producers’ pricing flexibility and erodes margin
competitiveness against imported steel arriving in bulk.
6.3 Structural Technology and Product Gap
6.3.1 Automotive-Grade Flat Steel Deficit
Indonesia continues to rely on imported:
- Advanced High-Strength Steel (AHSS)
- Automotive body sheet
- Precision cold rolled and coated products
- Specialty alloy steel
Reasons include:
- Limited blast furnace–basic oxygen furnace integration
- Limited R&D infrastructure
- Surface finishing precision constraints
- Smaller economies of scale
As a result, flat steel import penetration remains ~30–35% in 2025. This represents a structural vulnerability in Indonesia’s ambition to deepen manufacturing value chains.
6.3.2 Value-Added Asymmetry
Indonesia exports:
- Stainless slabs
- Semi-finished stainless
- Basic long steel
But imports:
- High-value engineered flat steel
- Specialty structural steel
- Automotive-grade material
This asymmetry reflects incomplete industrial upgrading.
6.4 Scrap Import Dependence
Indonesia’s EAF-dominant production requires ~8 million tons of scrap annually. Domestic scrap collection remains insufficient.
Risks:
- Global scrap price
- Export restrictions by scrap-supplying
- Rupiah depreciation
- Competition from Turkey and
Scrap price volatility during 2021–2022 demonstrated how raw material instability compresses domestic margins. Without development of a domestic scrap recycling ecosystem, cost volatility remains embedded.
6.5 Exposure to Global Overcapacity (China Factor)
China produces over 1 billion tons of steel annually. When Chinese domestic demand slows:
- Export volumes
- ASEAN markets absorb excess
- Price suppression
Indonesia’s trade defense measures mitigate but do not eliminate this exposure. Structural vulnerability persists during global downturn cycles.
6.6 Fragmentation of Long Steel Segment
The long steel sector remains moderately fragmented. Characteristics:
- Multiple sub-scale
- Intense price
- Low product
- Thin operating
Fragmentation prevents:
- Scale
- Technology
- Consolidated supply chain
Compared to Vietnam’s integrated large-scale producers, Indonesia’s long steel market lacks a dominant scale leader.
6.7 Case Study: The Collapse of the Krakatau–Osaka Joint Venture
One of the most instructive structural issues facing Indonesia’s steel industry was the eventual liquidationof PT Krakatau Osaka Steel, a joint venture between PT Krakatau Steel and Osaka Steel Co., Ltd.
Established in 2014 and commencing operations in 2017, the joint venture was designed to:
- Upgrade Indonesia’s long steel production standards
- Introduce Japanese technology and quality control
- Reduce reliance on imported rebar and structural products
- Support domestic infrastructure growth
Production capacity was approximately 0.5–0.7 million tons annually. Initially, the project appeared aligned with infrastructure expansion. However, structural challenges emerged:
- Aggressive pricing pressure from imported long steel, especially from
- Domestic market price
- Higher production cost relative to large-scale
- Fluctuations in infrastructure budget
- Structural cost disadvantages (energy, logistics).
Despite technological capability, the joint venture could not sustain competitive margins. Financial performance deteriorated. Attempts to find strategic investors failed. Ultimately, Osaka Steel withdrew and the company was liquidated.
The collapse of this joint venture illustrates deeper structural issues:
- Technology transfer alone cannot overcome cost disadvantage.
- Commodity long steel markets reward scale and lowest cost.
- Without structural competitiveness, protection becomes temporary relief.
- Infrastructure-driven demand is insufficient to guarantee viability.
This episode serves as a cautionary lesson for future industrial partnerships.
6.8 Financial Resilience and Leverage Risk
Steel production is capital-intensive and cyclical. Key risks include:
- High fixed cost exposure
- Working capital volatility
- Dependence on credit line
- Sensitivity to price cycles
The debt restructuring of Krakatau Steel before 2020 underscores: Financial misalignment + import pressure = systemic vulnerability. The industry must maintain prudent leverage to survive future downturns.
6.9 ESG and Carbon Transition Risk
Steel accounts for 7–8% of global CO₂ emissions. Indonesia’s coal-heavy energy mix increases carbon intensity. Risks include:
- EU CBAM financial impact post-2026.
- Export access constraints.
- ESG financing limitations.
- Green premium exclusion.
Indonesia currently lacks:
- Hydrogen-based steel pilot projects.
- Carbon capture integration.
- Clear green steel incentives.
Failure to adapt could weaken export competitiveness in 2030 onward.
6.10 Policy Dependency and Structural Reform Dilemma
Indonesia’s steel sector currently relies on:
- Anti-dumping
- Safeguards
- TKDN enforcement and Import licensing
This creates a structural dilemma: Protection stabilizes industry in short term but may reduce modernization incentive. Long-term competitiveness must shift from: Protection-based survival → Productivity-based competitiveness.
6.11 Infrastructure Demand Concentration Risk
Steel demand remains heavily dependent on:
- Government infrastructure project
- Public works
- Smelter construction
If fiscal tightening occurs or project pipeline slows:
- Long steel demand could contract sharply.
- Capacity utilization may fall below sustainable threshold (~75%).
Diversification toward export markets and higher-value products remains limited.
6.12 Structural Risk Summary
Major unresolved issues (2025):
- Energy cost disadvantage.
- Carbon transition lag.
- Automotive-grade flat steel gap.
- Scrap import dependancy.
- Long steel fragmentation.
- Import surge vulnerability.
- Policy protection reliance.
- Limited high-value export diversification.
- Lessons from failed joint ventures (Krakatau–Osaka).
6.13 Strategic Risk Outlook (2025–2030)
- Scenario A – Protection Continues Without Reform
→ Stability but stagnation.
- Scenario B – Liberalization Without Competitiveness Upgrade
→ Margin collapse and financial stress.
- Scenario C – Structural Reform
→ Energy transition + consolidation + technological upgrading + export diversification.
Only Scenario C ensures long-term industrial resilience.
Chapter 7: Benchmark and Common Practices
7.1 Strategic Positioning of Indonesia in the Global Steel Landscape
Between 2020 and 2025, Indonesia’s steel industry moved from structural vulnerability toward relative stabilization. Production expanded from approximately 12 million tons to nearly 18.5 million tons. Importpenetration declined gradually. Stainless steel exports grew significantly. Yet when benchmarked internationally, Indonesia remains a mid-tier steel producer undergoing incomplete transformation.
The global steel industry during this period was shaped by three major forces:
- Persistent Chinese overcapacity
- Supply chain realignment after COVID-19
- Rapid decarbonization pressure in advanced economies
Indonesia’s response has been largely defensive-protective in carbon steel and resource- integrative in stainless steel. Compared to peers, this creates an asymmetric competitive profile: strong in stainless due to nickel integration, but structurally weaker in high-grade carbon flat products.
Benchmarking Indonesia against ASEAN, India, South Korea, the European Union, and the United States reveals critical structural differences in scale, integration, technological sophistication, and carbon readiness.
7.2 ASEAN Benchmark: Scale Integration vs Policy Protection
Within ASEAN, Vietnam represents the most relevant comparator. Vietnam, led by Hoa Phat Group, adopted a large-scale integrated blast furnace strategy. By 2024, Vietnam’s production exceeded 22 million tons—higher than Indonesia—despite a smaller population. Vietnam’s model emphasizes:
- Integrated ironmaking (blast furnace)
- Economies of scale
- Flat steel self-sufficiency
- Export-driven growth
Indonesia, by contrast, relies predominantly on electric arc furnace (EAF) production and scrap imports. While Indonesia benefits from a larger domestic market, it remains partially dependent on imported automotive-grade flat steel. Thailand and Malaysia operate more liberalized steel markets with higherimport dependence and fewer aggressive trade defense measures. Indonesia’s policy stance is more interventionist than most ASEAN peers.
Conclusion: Vietnam outperforms Indonesia in integrated carbon steel scale. Indonesia outperforms ASEAN peers in stainless steel competitiveness.
7.3 India: Raw Material Sovereignty Model
India produces over 120 million tons annually and benefits from:
- Domestic iron ore reserves
- Integrated steel complexes
- Large internal demand base
- Increasing export orientation
India’s competitive strength lies in vertical integration and scale. Its blast furnace capacity reduces raw material import dependency. Indonesia lacks domestic iron ore integration and remains dependent on scrapimports for EAF operations. However, Indonesia’s nickel-based stainless cluster provides a niche advantage that India does not possess at comparable scale.
Conclusion: India’s advantage = scale + iron ore integration.
Indonesia’s advantage = nickel-driven stainless specialization.
7.4 South Korea: Technology and Premium Steel Leadership
South Korea, anchored by POSCO, represents a high-technology steel ecosystem. Core strengths include:
- Advanced automotive-grade flat steel
- High R&D intensity
- Strong export network
- Early hydrogen-based steel pilot projects
- Superior energy efficiency
Korea’s competitiveness is driven not only by scale but by technology depth and product sophistication.
Indonesia remains significantly behind in:
- Automotive-grade steel production
- High-strength alloy development
- Decarbonization innovation
Conclusion: Korea competes on technology and green steel. Indonesia competes onresource and domestic demand.
7.5 European Union and United States: Carbon and Protection Models
The European Union has prioritized decarbonization through:
- Carbon Border Adjustment Mechanism (CBAM)
- Hydrogen-based steel investments
- Carbon pricing integration
The United States combines:
- EAF-dominant production
- Mature scrap ecosystem
- Section 232 trade protection
- High labor productivity
Indonesia shares EAF dominance with the U.S., but lacks:
- Scrap abundance
- High productivity scale
- Green steel roadmap
Carbon transition readiness remains Indonesia’s weakest comparative dimension.
7.6 SWOT Analysis – Indonesia Steel Industry
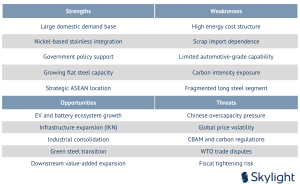
7.7 Strategic Interpretation
Indonesia’s structural position in 2025 can be summarized as:
- Regionally competitive
- Globally mid-tier
- Strong in stainless
- Incomplete in carbon flat integration
- Lagging in carbon transition
Indonesia has moved beyond vulnerability but has not yet achieved full industrial maturity.
The next stage of competitiveness requires:
- Carbon steel integration scaling
- Scrap ecosystem development
- Energy transition roadmap
- R&D strengthening
- Industry consolidation
Without these structural reforms, Indonesia risks remaining protected but not globally competitive.
Writer’s Opinion
Between 2020 and 2025, Indonesia’s steel industry proved that it could survive structural pressure. Production expanded from roughly 12 million tons to nearly 18.5 million tons. Stainless steel exports grew significantly. Import penetration in long steel declined. Trade defense measures prevented margin collapse during periods of global oversupply. In short, the industry stabilized.
However, stabilization is not the same as competitiveness. Indonesia today stands in an intermediate position. It is no longer structurally fragile, but it is not yet structurally strong. The industry’s resilience during this five-year period relied heavily on protection instruments — anti-dumping duties, safeguard tariffs, import licensing, and domestic content mandates. These tools created breathing space. They did not eliminate the structural cost gap.
Indonesia’s core strength lies in stainless steel integration driven by nickel down streaming. This is a genuine competitive advantage. Vertical integration from nickel ore to stainless slab has positioned Indonesia as a major global supplier. Few countries possess this resource leverage. In this segment, Indonesia competes not on protection but on structural cost integration.
In contrast, carbon steel — especially high-grade flat products — remains incomplete. Automotive-gradesteel, advanced high-strength steel, and certain coated products continue to rely on imports. The industry is predominantly electric arc furnace–based and dependent on imported scrap. Energy costs remain relatively high. Logistics inefficiencies increase distribution costs. Long steel remains fragmented. These realities limit Indonesia’s ability to compete without policy support.
The closure of the Krakatau–Osaka joint venture is an important lesson. The partnership brought technology and quality expertise, yet it could not withstand price pressure from imported commodity steel. This demonstrates a structural truth: in steel, technology alone does not guarantee viability if scale, energyefficiency, and cost structure are uncompetitive. Commodity segments reward the lowest sustainable cost producer. Without structural efficiency, protection only delays vulnerability.
Looking toward 2030 and beyond, Indonesia must transition from protection-based survival to productivity-based competitiveness. The path forward does not require copying Korea’s technology model or India’s iron ore integration model. Indonesia must leverage what it already possesses: market scale, resource advantage, and policy coordination. But it must add what it currently lacks: deeper flat steel capability, domestic scrap ecosystem development, energy transition planning, and industry consolidation.
Carbon transition will increasingly shape competitiveness. The European Union’s CBAM mechanism and ESG financing requirements are early signals that carbon intensity will influence pricing and market access. Indonesia’s coal-dominated power mix creates long- term exposure. Without gradual decarbonization, export potential may narrow. Green steel is not yet an immediate requirement domestically, but it will become unavoidable globally.
The fundamental question for Indonesia’s steel industry is not whether demand exists — it clearly does. The question is whether the industry can raise its productivity faster than protection is reduced. If structuralupgrading occurs, Indonesia can realistically reach 25–30 million tons of competitive production by 2030 and become ASEAN’s most balanced steel hub.
If reform slows and reliance on trade defense persists without modernization, the industry may remain stable but structurally limited. The period 2020–2025 laid the foundation for resilience. The period 2025–2035 must build structural strength. Indonesia has bought time through policy. It must now use that time to build competitiveness.
Conclusion
The period 2020–2025 marks a decisive chapter in the evolution of Indonesia’s steel industry. It was a perioddefined not only by growth, but by stress-testing. The COVID-19 shock, global steel price volatility, Chinese overcapacity pressure, energy cost spikes, and accelerating decarbonization policies forced Indonesia’s steel sector to confront its structural vulnerabilities. Yet during this time, the industry did not contract — it recalibrated.
Crude steel production increased from approximately 12 million tons in 2020 to nearly 18.5 million tons in 2025. Stainless steel output expanded significantly, positioning Indonesia as a major global supplier due to nickel integration. Import penetration declined gradually, particularly in long steel.
Trade balance moved closer to equilibrium in aggregate volume. Capacity utilization improved, and financialrestructuring efforts — particularly within state-owned enterprises — reduced systemic fragility.
These achievements should not be underestimated. Indonesia has avoided industrial contraction despite intense global competition. However, this stabilization was achieved largely through policy-driven instruments rather than through structural cost leadership.
The regulatory framework during 2020–2025 — including anti-dumping duties, safeguard tariffs, import licensing controls, and domestic content requirements (TKDN) — played a crucial defensive role. These measures shielded domestic producers from severe price suppression during periods of global oversupply, especially from China. At the same time, mineral down streaming policy reshaped the stainless-steel segment by forcing domestic processing of nickel, thereby enabling vertical integration and global exportcompetitiveness. Yet beneath this progress lies a structural duality.
On one side stands a globally competitive stainless-steel ecosystem, supported by raw material integration and scale investment. On the other stands a carbon steel sector that remains partially import-dependent,technologically uneven, and sensitive to cost pressures. High-grade flat steel for automotive and advanced manufacturing continues to rely on imports.
Long steel remains fragmented and vulnerable to construction cycle volatility. Scrap import dependence exposes producers to raw material price swings and currency fluctuations. Energy costs remain elevated, and carbon intensity remains high relative to advanced economies.
International benchmarking clarifies this position. Compared with Vietnam, Indonesia lags in integrated carbon steel scale. Compared with India, it lacks iron ore integration and scale magnitude. Compared with South Korea and the European Union, it remains behind in technology sophistication and green steel readiness.
Compared with the United States, it lacks a mature domestic scrap ecosystem and productivity scale.Indonesia’s stainless strength is real — but carbon steel competitiveness remains incomplete.
The closure of the Krakatau–Osaka joint venture further illustrates the structural challenge. Despitetechnological collaboration and quality improvement, the venture could not withstand sustained import competition and cost disadvantage in a commodity-driven segment. The lesson is clear: industrial upgrading requires not only technology transfer, but also scale efficiency, cost optimization, and stable demand integration.
Looking forward, Indonesia’s steel industry stands at a structural crossroads. Demand fundamentals are strong. Infrastructure expansion, IKN Nusantara development, industrial estate growth, EV battery ecosystem development, and continued urbanization ensure that domestic steel consumption will risesteadily toward 25–30 million tons by 2030. The demand side is not the constraint.
The constraint lies in competitiveness. If Indonesia continues to rely primarily on trade defense measureswithout accelerating productivity improvements, the industry may remain stable but structurally constrained. Protection can buffer cyclical shocks, but it cannot permanently compensate for energy inefficiency, fragmentation, or technological gaps.
Moreover, global carbon regulation — particularly under the EU’s CBAM framework — will increasingly shape export competitiveness. Without gradual decarbonization and energy transition, Indonesia’s steel exports may face cost disadvantages in premium markets.
However, Indonesia also possesses unique structural advantages. Its nickel resource base gives it long-term stainless competitiveness. Its domestic market size provides scale potential. Its strategic location within ASEAN offers regional export opportunities. Its government has demonstrated willingness to intervene and support strategic industry.
The critical task for the next decade is to convert stabilization into structural strength. This requires:
- Expanding integrated flat steel capability to reduce import dependence in high-grade products.
- Developing a domestic scrap ecosystem to stabilize raw material supply.
- Encouraging consolidation in fragmented long steel segments to achieve economies of scale.
- Investing in energy efficiency and gradual decarbonization.
- Moving further up the value chain in stainless and engineered steel products.
Between 2020 and 2025, Indonesia bought time through policy protection and resource- based integration.Between 2025 and 2035, Indonesia must invest that time into productivity, technology, and sustainability. The industry is no longer fragile — but it is not yet globally formidable. Indonesia has the market size, resource base, and policy leverage to become ASEAN’s most strategically balanced steel hub. Whether it achieves that status will depend not on demand growth, but on how decisively it addresses structural competitiveness. The foundation has been laid, and the next phase will determine the outcome.
Sources
- Skylight Analytics Hub
- World Steel Association – World Steel in Figures (2020–2024), Production, demand, global comparison data, https://worldsteel.org/steel-topics/statistics/world-steel-in- figures/
- World Steel Association – Short Range Outlook Reports, Global demand and forecast analysis, https://worldsteel.org/steel-topics/statistics/short-range-outlook/
- OECD Steel Committee – Steel Market Developments Reports, Global overcapacity and trade policy analysis, https://oecd.org/industry/steel/
- International Energy Agency (IEA) – Iron and Steel Technology Roadmap Energy and decarbonization benchmarks, https://iea.org/reports/iron-and-steel-technology- roadmap
- Ministry of Industry of Indonesia (Kementerian Perindustrian RI), National Industrial Development Plan (RIPIN) and steel industry policy, https://kemenperin.go.id
- Ministry of Trade of Indonesia (Kementerian Perdagangan RI), Anti-dumping and safeguard regulations, https://kemendag.go.id
- Indonesian Anti-Dumping Committee (KADI), Anti-dumping investigation decisions, http://kadi.kemendag.go.id
- Ministry of Finance of Indonesia – Directorate General of Customs, Import tariff schedule (HS Chapter 72 & 73), https://beacukai.go.id
- Indonesia National Trade Repository (INSW) – HS Code Tariff Information, https://insw.go.id
- Badan Pusat Statistik (BPS) – Indonesia, Import/export steel data and macroeconomic statistics, https://bps.go.id
- Indonesia Investment Coordinating Board (BKPM), Foreign Direct Investment realization reports, https://bkpm.go.id
- PT Krakatau Steel – Annual Reports (2020–2024), https://krakatausteel.com
- PT Indonesia Tsingshan Stainless Steel (Corporate Information via Industrial Park Reports), https://imi.co.id (Morowali Industrial Park information)
- Hoa Phat Group – Annual Reports, https://hoaphat.com.vn
- POSCO – Sustainability and Annual Reports, https://posco.com
- European Commission – Carbon Border Adjustment Mechanism (CBAM), https://taxation-customs.ec.europa.eu/carbon-border-adjustment-mechanism_en
- World Trade Organization (WTO) – Trade Policy Review Indonesia, https://wto.org
- United States International Trade Commission – Section 232 Steel Measures, https://usitc.gov
- ASEAN Secretariat – ASEAN Trade in Goods Agreement (ATIGA), https://asean.org
- Osaka Steel , Ltd. – Corporate Disclosure, https://www.osaka-seitetu.co.jp